

1 引 言
2 研究区域概况、 模式介绍和数据来源
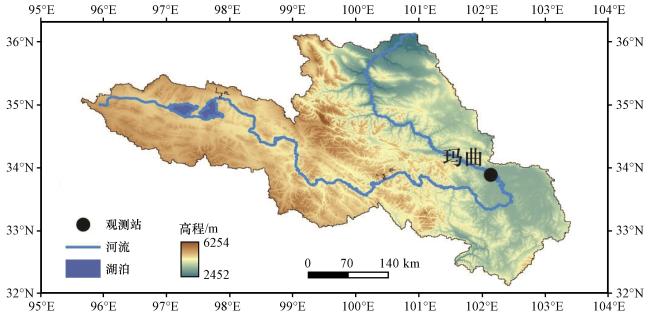
2.1 研究区域概况
2.2 CLM5.0模式介绍
2.3 数据来源
3 数据处理及分析方法
3.1 土壤热通量的计算
3.2 土壤冻融阶段的划分及典型晴天的定义
表1 土壤冻融过程阶段划分及典型晴天日Table 1 Date of soil freezing and thawing process stage process and typical clear day |
| 土壤状态 | 起止时间 | 日数/天* | 典型晴天日 | |
|---|---|---|---|---|
| 开始时间 | 结束时间 | |||
| 完全消融 | 2017-08-01 | 2017-11-23 | 115 | 2017-09-11、 2017-10-06、 2017-11-01、 2017-11-13 |
| 冻结过程 | 2017-11-24 | 2017-12-02 | 9 | - |
| 完全冻结 | 2017-12-03 | 2018-02-26 | 86 | 2017-12-10、 2017-12-12、 2017-12-20、 2017-12-24、 2017-12-27、 2018-01-5、 2018-01-12、 2018-01-22~2018-01-24 |
| 消融过程 | 2018-02-27 | 2018-03-15 | 17 | 2018-03-05 |
| 完全消融 | 2018-03-16 | 2018-07-31 | 137 | 2018-04-08、 2018-04-16、 2018-05-12、 2018-05-13 |
*日数: 仅对2017年8月1日至2018年7月31日中各土壤冻融过程阶段日数进行统计 |
4 土壤冻融过程中地表水热交换的观测及模拟研究
4.1 CLM5.0模拟结果验证
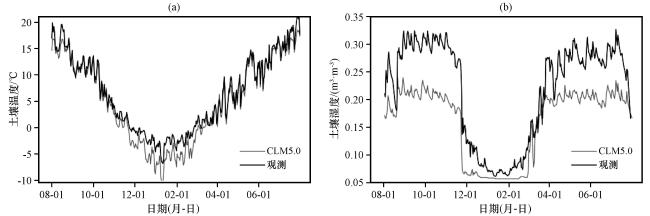
表2 土壤温度、 湿度、 辐射通量及能量通量日均值误差统计Table 2 Error statistics of daily mean soil temperature, soil moisture, radiant flux and energy flux for Maqu site between the simulation data and observations |
| 气象要素 | R | RMSE | Bias |
|---|---|---|---|
| 土壤温度 | 0.991* | 1.78 ℃ | -1.31 ℃ |
| 土壤湿度 | 0.962* | 0.07 m3·m-3 | -0.06 m3·m-3 |
| 入射短波辐射 | 0.966* | 19.3 W·m-2 | 1.2 W·m-2 |
| 反射短波辐射 | 0.737* | 21.4 W·m-2 | -10.6 W·m-2 |
| 向下长波辐射 | 0.998* | 4.5 W·m-2 | 0.5 W·m-2 |
| 向上长波辐射 | 0.979* | 8.6 W·m-2 | 3.0 W·m-2 |
| 感热通量 | 0.553* | 29.1 W·m-2 | 16.2 W·m-2 |
| 潜热通量 | 0.901* | 11.1 W·m-2 | -0.8 W·m-2 |
| 净辐射通量 | 0.945* | 21.6 W·m-2 | 9.0 W·m-2 |
*表示通过95%的显著性水平检验 |
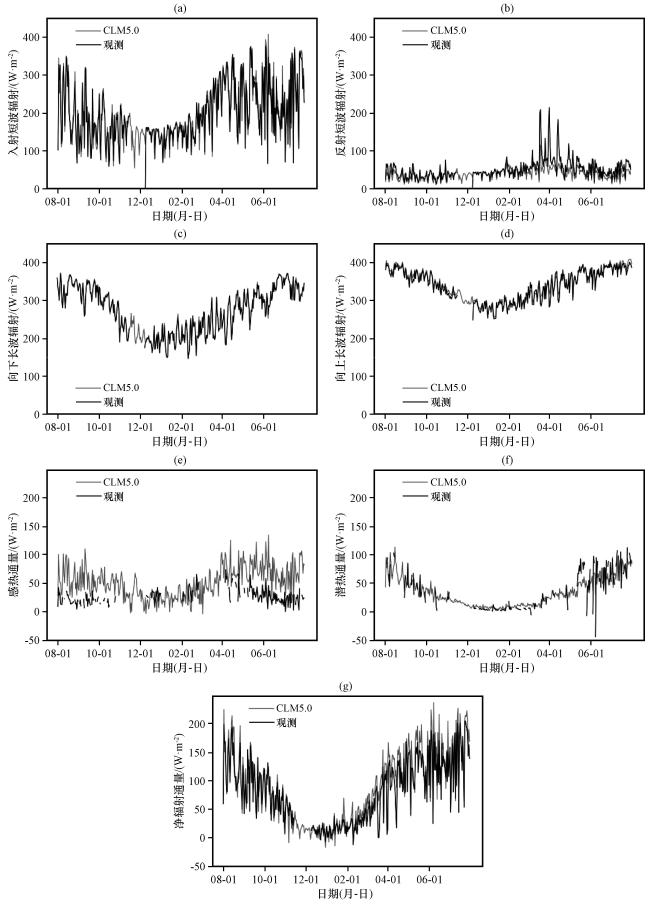
图3 2017年8月至2018年7月玛曲CLM5.0模式和观测数据的入射短波辐射(a)、 反射短波辐射(b)、 向下长波辐射(c)、 向上长波辐射(d)、 感热通量(e)、 潜热通量(f)和净辐射通量(g)日平均变化Fig.3 Changes of daily mean downward shortwave radiation (a), upward shortwave radiation (b), downward longwave radiation (c), upward longwave radiation (d), sensible heat flux (e), latent heat flux (f) and net radiation flux (g) from CLM5.0 model and observations at Maqu from August 2017 to July 2018 |
4.2 土壤温度和湿度日变化特征
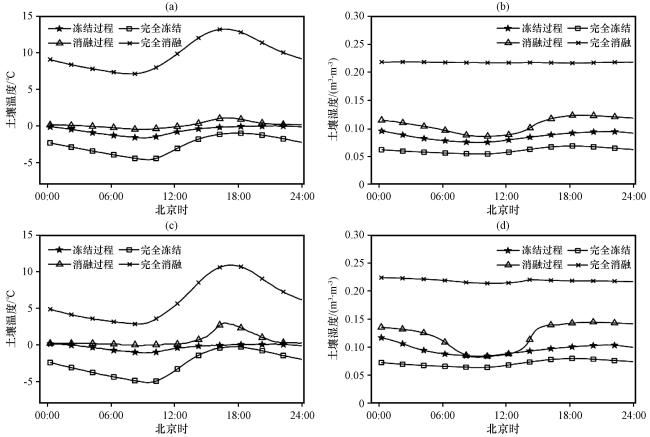
4.3 辐射通量日变化特征
表3 2017年8月至2018年7月玛曲各冻融过程阶段的辐射通量、 能量通量、 反照率、 波文比平均值及降雪日数统计Table 3 Average radiation flux, energy flux, albedo and Bowen ratio and statistics of snowfall days in different freeze-thaw process stages at site Maqu from August 2017 to July 2018 |
| 冻融阶段 | DS /(W·m-2) | US /(W·m-2) | Albedo | DL /(W·m-2) | UL /(W·m-2) | Rn /(W·m-2) | SH /(W·m-2) | LE /(W·m-2) | β | G 0 /(W·m-2) | 积雪日数 /天 |
|---|---|---|---|---|---|---|---|---|---|---|---|
| 冻结过程 | 141.3 | 34.4 | 0.25 | 203.4 | 293.9 | 16.4 | 39.3 | 12.0 | 3.3 | -9.1 | 0 |
| 完全冻结 | 146.8 | 43.7 | 0.29 | 197.8 | 285.2 | 15.9 | 30.1 | 5.0 | 6.1 | -5.6 | 6 |
| 消融过程 | 201.2 | 60.7 | 0.30 | 225.8 | 315.4 | 50.1 | 38.8 | 6.6 | 5.9 | 3.4 | 1 |
| 完全消融 | 216.9 | 52.0 | 0.24 | 295.9 | 360.9 | 117.9 | 30.4 | 89.5 | 0.3 | 1.2 | 18 |
除土壤热通量及降雪日数外, 冻结过程阶段缺测的观测数据由模拟数据代替 |
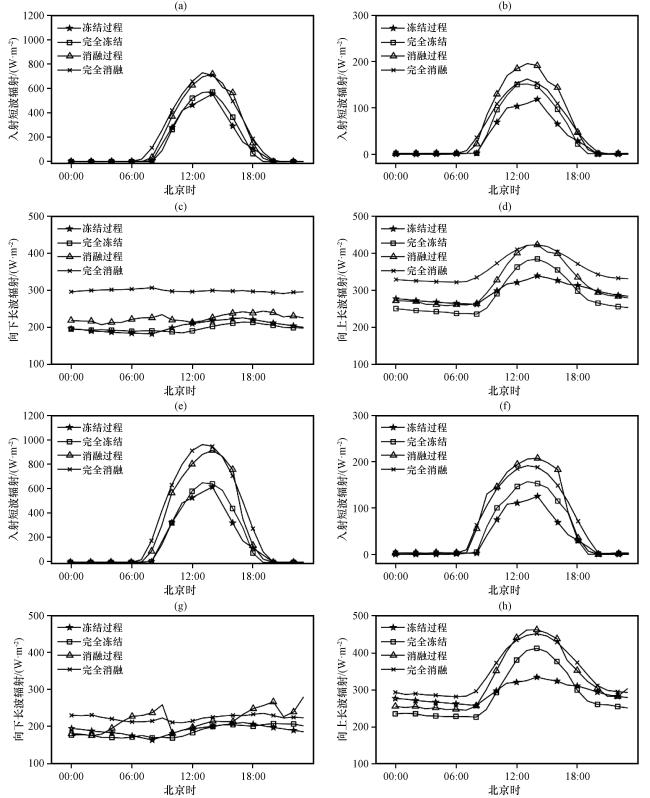
图5 各冻融阶段玛曲辐射能量通量阶段平均 (a~d)及典型晴天(e~h)日变化其中冻结过程阶段缺失的观测数据用模拟结果代替 Fig.5 Diurnal variations of radiant energy flux at Maqu averaged (a~d) and typical clear day (e~h) in different freeze-thaw process stages.The missing observation data in the freezing process stage is replaced by the simulation results |
4.4 能量通量日变化特征
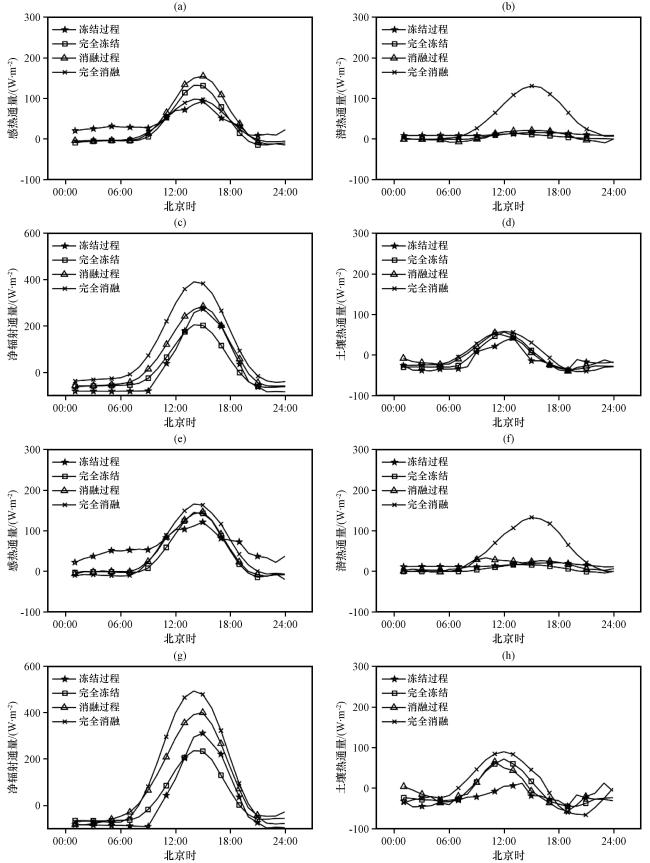
图6 各土壤冻融阶段玛曲感热通量、 潜热通量、 净辐射通量和土壤热通量阶段平均(a ~d)及典型晴天(e ~h)日变化除土壤热通量外, 在冻结过程阶段缺失的观测数据由模拟结果代替 Fig.6 Diurnal variations of sensible heat flux, latent heat flux, net radiation flux and soil surface heat flux at Maqu averaged(a ~d) and typical clear day (e ~h) in different freeze-thaw process stages.The missing observation data in the freezing process stage is replaced by the simulation results, except soil surface heat flux |
4.5 土壤温度、 湿度及能量通量的年变化特征
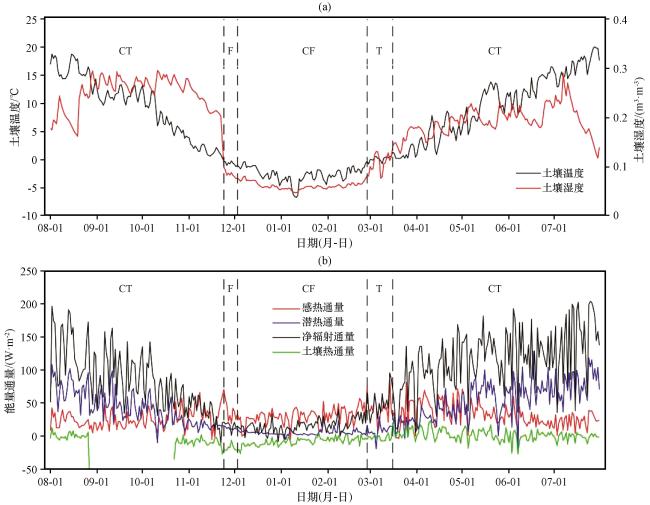
图7 2017年8月至2018年7月0.05 m层土壤温度和湿度变化(a)及能量通量变化(b)F为冻结过程阶段, CF为完全冻结阶段, T为冻结过程阶段, CT为完全消融阶段; 冻结过程阶段除土壤热通量外用模拟结果代替缺失的观测数据 Fig.7 Variation of soil temperature and soil moisture at 0.05 m (a) and variation of energy flux (b) at site Maqu from August 2017 to July 2018.F refers to freezing stage, CF refers to completely frozen stage, T refers to thawing stage, CT refers to completely thawed stage.The missing observation data of energy flux in the freezing process stage is replaced by the simulation results, except soil surface heat flux |
4.6 土壤冻融过程中地表能量收支平衡的变化特征
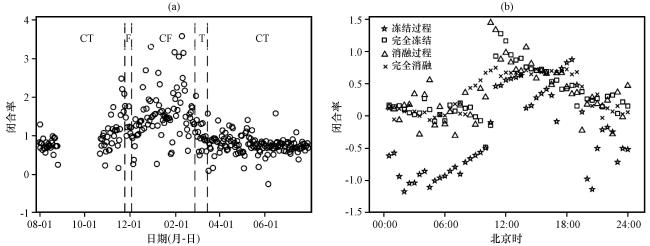


图8 地表能量闭合率日均值年变化(a)及日变化(b)F为冻结过程阶段, CF为完全冻结阶段, T为冻结过程阶段, CT为完全消融阶段; 冻结过程阶段闭合率由模拟的感热通量、 潜热通量、 净辐射通量及计算的土壤热通量计算 Fig.8 Annual variation of daily average CR (a), diurnal variations of closure ratio (CR) averaged in different freeze/thaw stages (b).F refers to freezing stage, CF refers to completely frozen stage, T refers to thawing stage, CT refers to completely thawed stage.The closure rate of freezing process is calculated from the simulated sensible heat flux, latent heat flux, net radiation flux and calculated soil heat flux |