

1 引言
2 研究区域和数据介绍
2.1 研究区域概况
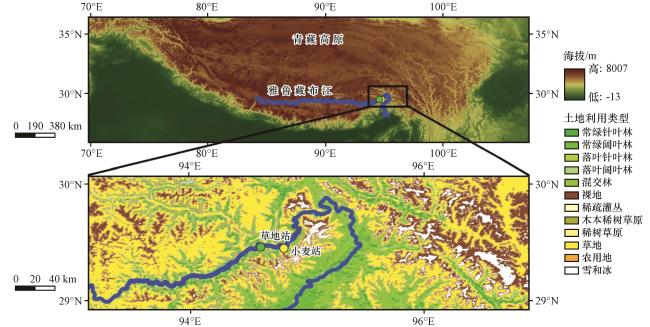
2.2 数据介绍
3 研究方法和模式介绍
3.1 CLM5.0陆面过程模式介绍
3.2 热力粗糙度参数化方案介绍
表1 本研究拟采用的热力学粗糙度参数化方案Table 1 The thermal roughness length parameterization schemes to be deployed in this study |
| 公式 | 参考文献 | 缩写 |
|---|---|---|
| Z 0h =Z 0m ×exp(-2.0) | Garratt and Francey(1978) | G78 |
| Z 0h =Z 0m ×exp(-0.208Re ) | Zeng and Dickinson (1998) | Z98 |
| Z 0h =Z 0m ×exp(2.0-1.29Re ) | Kanda et al(2007) | K07 |
| Z 0h =(70v/u* )×exp(-βu |T*| 0.25) | Yang et al(2008) | Y08 |
3.3 大气水汽输送条件的分类方法
表2 水汽输送条件判断方法Table 2 Classification method of water vapor transport conditions |
| 水汽条件 | 判断方法 |
|---|---|
| 强水汽输送条件 | 大于SF、 WF和PWV的51日绝对值均值(92.9×10⁵ kg·s-1、 45.6×10⁵ kg·s-1和14.5 mm)的120% |
| 弱水汽输送条件 | 小于SF、 WF和PWV的51日绝对值均值的80% |
| 极弱水汽输送条件 | 小于SF、 WF和PWV的51日绝对值均值的50% |
4 结果与分析
4.1 CLM5.0对大峡谷地区陆-气间水热交换通量区域模拟性能的检验
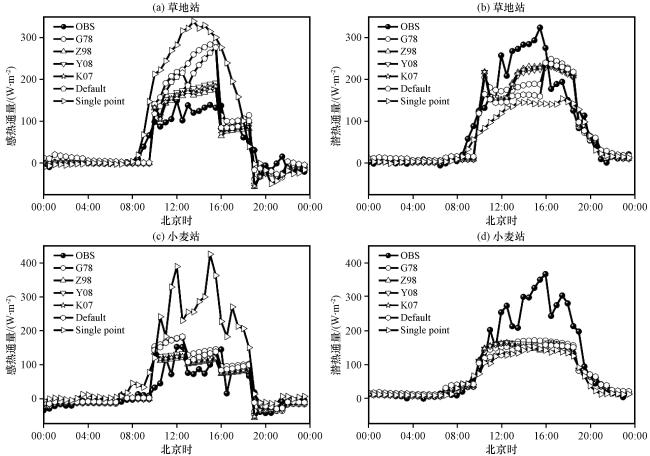
图2 藏东南草地站(a, b)和小麦站(c, d)陆-气间水热交换通量模拟值和实测值的日变化差异Fig.2 Differences between simulated and measured diurnal variations of near-surface turbulent fluxes at grassland (a, b) and wheat (c, d) stations in southeastern Xizang |
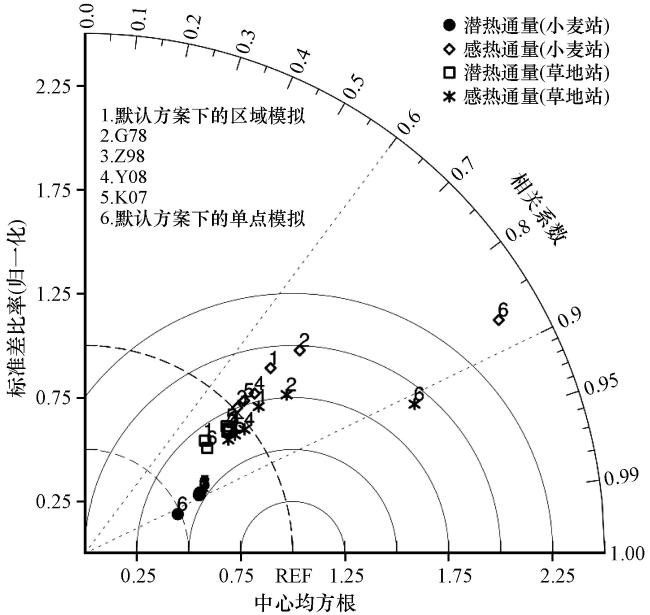
表3 2013年5月20日至7月9日逐30 min近地面感热和潜热通量模拟值和站点实测值的统计参数Table 3 Statistical parameters of simulated and measured values of near-surface sensible and latent heat fluxes every 30 min from May 20 to July 9, 2013 |
| 站点 名称 | 陆-气间水热交换通量 | 参数化方案名称 | RMSE /(W·m-2) |
|---|---|---|---|
| 草地站 | 感热通量 | 默认方案(区域) | 39.5 |
| G78 | 41.2 | ||
| Z98 | 35.2 | ||
| Y08 | 35.3 | ||
| K07 | 35.4 | ||
| 默认方案(单点) | 57.2 | ||
| 草地站 | 潜热通量 | 默认方案(区域) | 46.8 |
| G78 | 46.8 | ||
| Z98 | 45.6 | ||
| Y08 | 46.0 | ||
| K07 | 45.8 | ||
| 默认方案(单点) | 44.4 | ||
| 小麦站 | 感热通量 | 默认方案(区域) | 42.8 |
| G78 | 47.0 | ||
| Z98 | 35.2 | ||
| Y08 | 37.1 | ||
| K07 | 36.0 | ||
| 默认方案(单点) | 87.4 | ||
| 小麦站 | 潜热通量 | 默认方案(区域) | 53.3 |
| G78 | 53.1 | ||
| Z98 | 52.2 | ||
| Y08 | 52.4 | ||
| K07 | 52.3 | ||
| 默认方案(单点) | 65.5 |
4.2 大气水汽及其输送与雅鲁藏布大峡谷-大气间水热交换过程耦合关系分析
4.2.1 大峡谷地区水汽输送格局
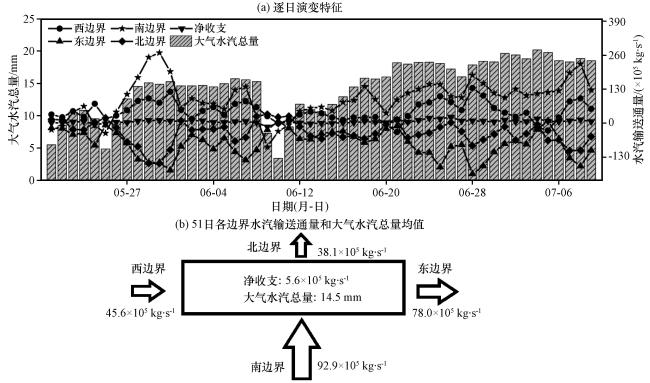
表4 强/弱/极弱水汽输送条件下筛选的日期及对应的水汽格局判别参数Table 4 Dates screened and corresponding water vapor pattern discriminating parameters under strong/weak/very weak water vapor conditions |
| 时期 | 水汽输送条件 | 大气水汽总量/mm | 南边界水汽输送通量/(×105 kg·s-1) | 西边界水汽输送通量/(×105 kg·s-1) |
|---|---|---|---|---|
| 6月23日 | 强水汽输送条件 | 18.3 | 129.3 | 71.3 |
| 5月26日 | 弱水汽输送条件 | 9.1 | 52.1 | 28.9 |
| 6月10日 | 极弱水汽条件 | 3.4 | -32.1 | -1.1 |
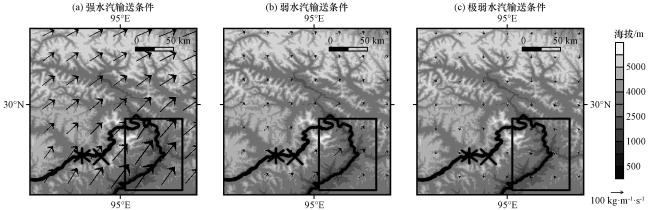
图5 雅鲁藏布大峡谷地区强/弱/极弱水汽输送条件下水汽输送格局黑色符号×和*分别为小麦站和草地站, 黑色实线为雅鲁藏布江, 黑色实框线(29.05°N -29.65°N, 95.05°E -95.65°E)为水汽强输送带 Fig.5 The water vapor transport pattern over the Yarlung Zangbo Grand Canyon area under strong/weak/extremely weak water vapor transportation conditions.The black symbols × and * are the Wheat site and the Grasslandsite respectively, and the solid black line is the Yarlung Zangbo River, The black solid frame line (29.05°N -29.65°N, 95.05°E -95.65°E) is the strong water vapor conveyor belt |
4.2.2 强/弱/极弱水汽输送条件下大峡谷地区的水热交换格局
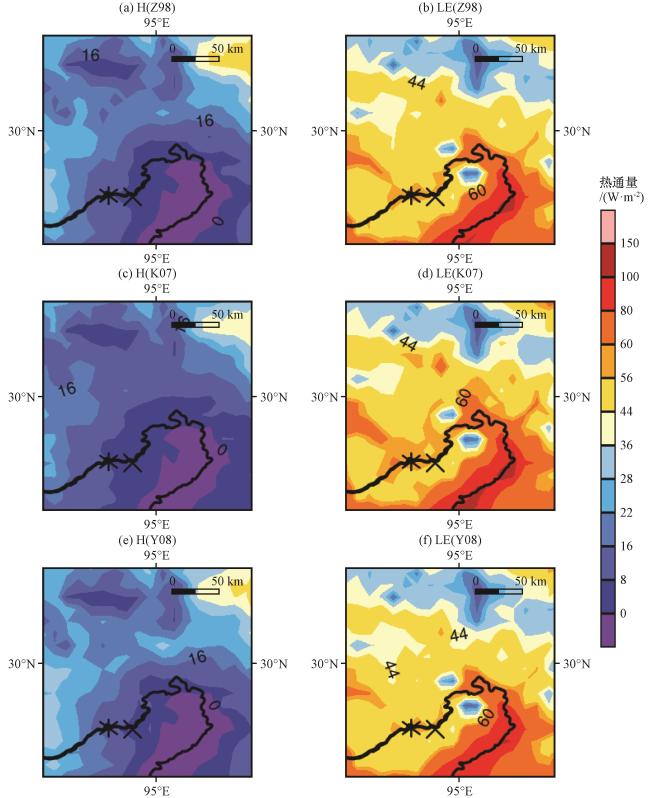
图6 强水汽输送条件下Z98、 Y08和K07参数化方案和土壤属性替代数据集下CMFD驱动CLM区域模拟的雅鲁藏布大峡谷地区近地面-大气间感热和潜热交换通量日均值空间分布特征黑色符号“×”和“*”分别代表小麦站和草地站, 黑色实线为雅鲁藏布江 Fig.6 The characteristics of the regional distribution of mean sensible and latent fluxes between land and atmosphere simulated by CMFD drove CLM over the Yarlung Zangbo Grand Canyon area by using the Z98, Y08, and K07 schemes and soil property datasets under strong water vapor conditions, the black symbols "×" and "*" represent the Wheat site and Grassland site, respectively, the black solid line is the Yarlung Zangbo River |
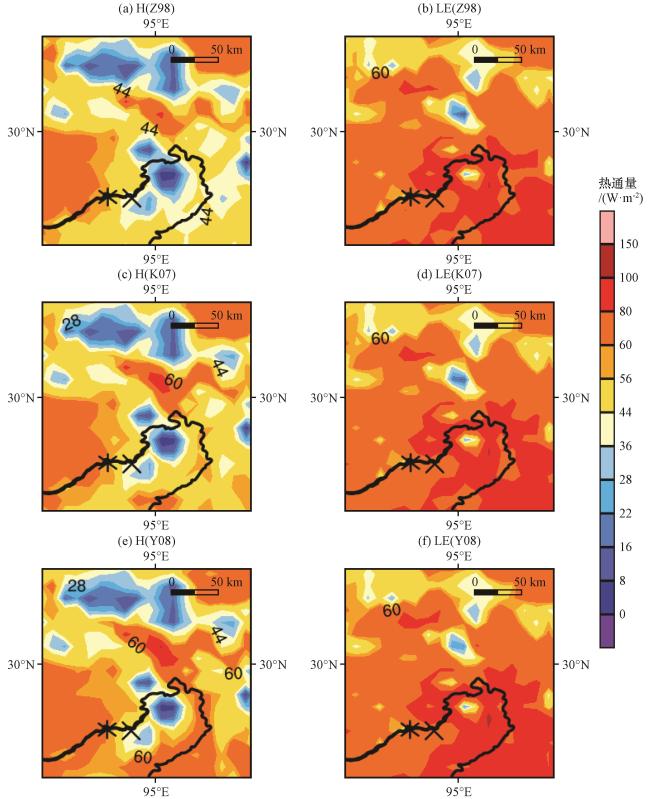
图7 弱水汽输送条件下Z98、 Y08和K07参数化方案和土壤属性替代数据集下CMFD驱动CLM区域模拟的雅鲁藏布大峡谷地区近地面-大气间感热和潜热交换通量日均值空间分布特征黑色符号“×”和“*”分别代表小麦站和草地站, 黑色实线为雅鲁藏布江 Fig.7 The characteristics of the regional distribution of mean sensible and latent fluxes between land and atmosphere simulated by CMFD drove CLM over the Yarlung Zangbo Grand Canyon area by using the Z98, Y08, and K07 schemes and soil property datasets under weak water vapor conditions, the black symbols "×" and "*" represent the Wheat site and Grassland site, respectively, the black solid line is the Yarlung Zangbo River |
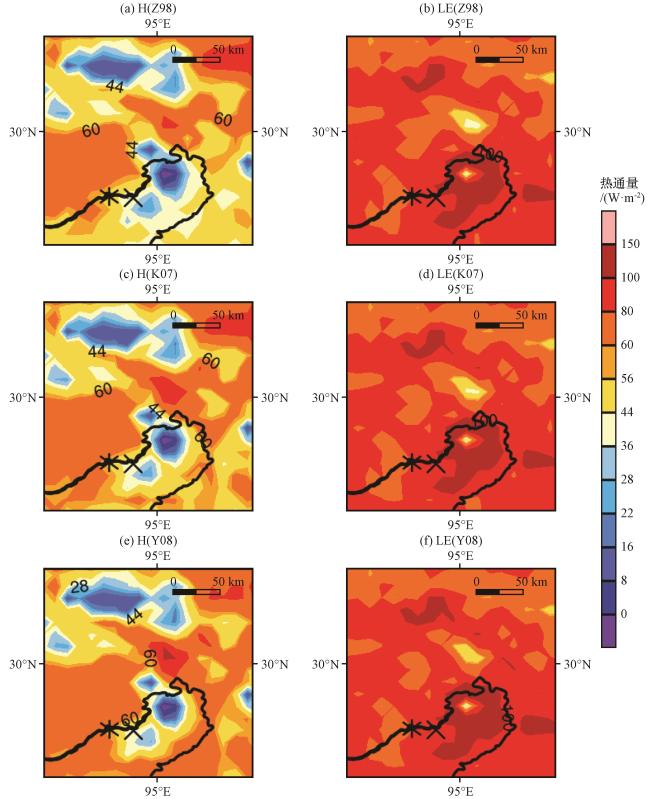


图8 极弱水汽输送条件下Z98、 Y08和K07参数化方案和土壤属性替代数据集下CMFD驱动CLM区域模拟的雅鲁藏布大峡谷地区近地面-大气间感热和潜热交换通量日均值空间分布特征黑色符号“×”和“*”分别代表小麦站和草地站, 黑色实线为雅鲁藏布江 Fig.8 The characteristics of the regional distribution of mean sensible and latent fluxes between land and atmosphere simulated by CMFD drove CLM over the Yarlung Zangbo Grand Canyon area by using the Z98, Y08, and K07 schemes and soil property datasets under extremely weak water vapor conditions, the black symbols "×" and "*" represent the Wheat site and Grassland site, respectively, the black solid line is the Yarlung Zangbo River |
4.2.3 大峡谷地区大气水汽及其输送对陆-气间水热交换过程的影响机制分析
表5 大峡谷地区不同水汽输送条件, 三种参数化方案下CMFD驱动CLM模拟的水汽强输送带(29.05°N -29.65°N, 95.05°E -95.65°E)近地面净辐射和近地面感热和潜热通量的日峰值和均值Table 5 Daily peak and average values of near-surface net radiation and near-surface sensible and latent heat fluxes in the water vapor strong conveyor belt (29.05°N -29.65°N, 95.05°E -95.65°E) simulated by CMFD drove CLM under different water vapor transport conditions in the Grand Canyon area under the three parameterization schemes |
| 热力学粗糙度 参数化方案 | 通量 | 强水汽输送条件 (均值/日峰值) | 弱水汽输送条件 (均值/日峰值) | 极弱水汽输送条件 (均值/日峰值) |
|---|---|---|---|---|
| Z98方案 | 感热通量/(W·m-2) | -1.8/24.6 | 41.3/159.2 | 41.5/188.6 |
| 潜热通量/(W·m-2) | 74.7/197.6 | 82.7/225.6 | 93.1/233.5 | |
| 净辐射/(W·m-2) | 66.2/238.8 | 138.7/575.1 | 148.8/628.1 | |
| Y08方案 | 感热通量/(W·m-2) | -2.8/27.6 | 55.4/235.2 | 55.7/268.6 |
| 潜热通量/(W·m-2) | 73.4/190.9 | 85.4/199.5 | 95.7/248.8 | |
| 净辐射/(W·m-2) | 66.6/240.2 | 142.8/586.4 | 153.1/641.5 | |
| K07方案 | 感热通量/(W·m-2) | -2.2/25.6 | 48.9/195.8 | 50.0/232.7 |
| 潜热通量/(W·m-2) | 74.0/194.6 | 83.0/212.8 | 92.9/242.5 | |
| 净辐射/(W·m-2) | 66.3/239.2 | 140.7/580.4 | 151.2/634.9 |