

1 引言
中国西北地区地处大陆内部, 大部分地域属于干旱与半干旱气候区, 受到季风和西风带的共同作用, 年降水量主要集中在夏季, 但是水汽不足导致区域降水量偏小。西北大部分地区由干状态转变为湿状态的时间较长, 明显长于由湿状态转变为干状态的时间, 说明了西北地区更容易保持干旱的状态(张明阳等, 2004)。西北地区地形较为复杂, 具有多种地貌特征, 并且气候差异性比较大, 气候稳定性也比较差(陈志昆等, 2013), 导致降水量的多少对区域有着极其重要的影响。因此, 针对西北地区降水特征的形成及其预测的研究具有重要意义。
针对于降水机制研究, 除了云微物理过程外, 有利的环流条件会为降水提供水汽及上升气流。东亚季风、 西太平洋副热带高压和高原地形作用等会在来源于孟加拉湾和南海等地区的水汽向西北地区传输中, 对水汽总量和传输的路径会造成十分重要的影响, 并且降水的异常现象与环流的异常特征联系紧密(任宏利等, 2004; 魏娜等, 2010)。由于水汽传输导致云量变化同降水有明显的相关性, 按照西北地区水汽来源的不同可以将其分为高原影响区, 西风带影响区与东亚季风影响区(封彩云等, 2009; 王宝鉴等, 2006)。当巴尔喀什湖低槽偏强, 西北地区上升运动明显并且偏南气流偏多, 配合上来自洋面充足的水汽导致形成明显的水汽辐合区, 造成西北地区降水增多(卢国阳等, 2021)。此外, 大尺度环流还可以将其他地区的信息传递至西北地区。西北地区春季降水量与太平洋海表温度相关(王澄海等, 2002)。北极涛动的夏季特征与夏季西北地区的干湿状态之间存在着明显的相关关系(王鹏祥等, 2007)。
统计降尺度方法是通过构建大尺度环流特征和区域性降水特征之间的统计关系, 之后将气候模式输出大尺度环流信息带入模型中从而预测未来局地降水, 是研究区域气候特征的常用方法(Fowler et al, 2007; Hewitson and Crane, 2006)。由于模式对于次网格尺度区域降水模拟效果较差, 弱于其对大尺度环流的模拟, 所以用统计降尺度方法可以提升模式对局地降水的模拟效果(Wilby, 1997; Yarnal et al, 2001)。Guo et al(2011)将500 hPa高度场和700 hPa的水汽传递作为影响因子, 构建了长江中下游地区降水的降尺度模型; Li and Smith(2009)将海平面气压场的主要特征与澳大利亚的降水特征联系起来, 构建降尺度模型从而预测未来降水; 还有学者利用分离时间尺度的方法, 研究了华北地区汛期的降水特征, 并根据时间尺度不同分别构建了华北汛期降水年际和年代际的降尺度模型, 较为准确地预测了未来的华北汛期降水(郭彦和李建平, 2012; Guo et al, 2014); 阮成卿等(2015)利用欧洲西部海表面气压与热带西太平洋海温构建了中国西南后冬季节降水的统计降尺度模型, 较好地拟合了中国西南地区整体和逐站的后冬季节降水变率。
目前, 将统计降尺度方法应用于西北地区降水预测的研究还未见报道。因此, 本文在研究西北地区1961-2018年降水特征的基础上, 使用基于偏相关的大尺度环流影响因子选择方法, 挑选出了影响中国西北地区东部夏季降水的环流因子, 并构建了西北地区东部降水统计降尺度模型, 为提供西北地区降水短期气候预测的准确率提供科学参考。
2 资料来源与方法介绍
2.1 资料来源
使用的中国西北降水数据为中国气象局气象数据中心提供的1961 -2018年CN05.1格点数据(吴佳和高学杰, 2013), 其水平网格距为0.25°×0.25°, 所选西北地区格点位于35°N以北、 111°E以西; 此外, 还用到了由美国环境预报中心(the National Centers for Environmental Prediction, NCEP)和国家大气研究中心(the National Center for Atmospheric Research, NCAR)发布的水平网格距为1°×1°的海表面温度资料以及全球逐月的再分析数据(Kalnay et al, 1996), 其水平网格距为2.5°×2.5°, 包括位势高度场、 风场及海平面气压场数据。文中涉及的地图是基于中华人民共和国自然资源部地图技术审查中心标准地图服务系统下载的审图号为GS(2016)1550号的中国地图制作, 底图无修改。
2.2 研究方法
2.2.1 偏相关因子选择方法
局地降水常常受到多个大尺度环流因子的影响, 当一个重要强迫因子被选定时, 这个因子可以解释该地区部分的降水变率, 而剩余部分的降水变率是该因子无法解释的, 因此要想有效地找到剩余部分的降水变率所相关的影响因子, 需要采用偏相关因子选择法进行筛选, 具体的过程是: (1)通过大尺度环流场与降水序列的相关分析, 挑选出一系列潜在影响因子; (2)采取剔去一个数据的检验方法, 得出所挑选出的潜在因子的均方根误差(RMSE), 选出RMSE最小的因子作为第一个进入模型的因子; (3)对该因子同局地降水量进行显著性检验; (4)通过显著性检验后将该因子可以解释的部分信号从降水信息中去除, 把余下部分的降水信息当作新的序列, 然后重复进行之前的步骤, 继续筛选下一个环流影响因子; 直至挑选出的因子与原降水量之间相关性未能通过检验, 则因子挑选完成, 将最终入选的因子作为预报因子进行下一步的模型构建(阮成卿等, 2015)。
通过偏相关因子选择方法所筛选出的新因子是和已选因子未能解释的部分降水信息高度相关, 进而对可解释部分降水信息的因子进行补充, 通过偏相关方法逐步找到影响因子, 使得降水信息可以逐步地被解释, 这可以有效地提升模型的预报能力。
2.2.2 去趋势相关分析法
去趋势相关分析可以有效地避免由于数据非平稳性所导致的序列之间的虚假相关(刘春琼等, 2016)。本文采用的方法是将环流信息与预报因子分别和时间进行线性拟合之后消除趋势, 从而计算因子序列和大尺度环流场之间的相关关系。
3 西北地区降水特征
西北地区是中蒙干旱区的主体部分, 约82%的地域处于年平均降水量小于500 mm的干旱半干旱区(钱正安等, 2011), 该地区近60%的降水发生在夏季(6 -8月)(周建琴等, 2009; 李江林等, 2012)。因此, 本文主要讨论西北夏季的降水特征。
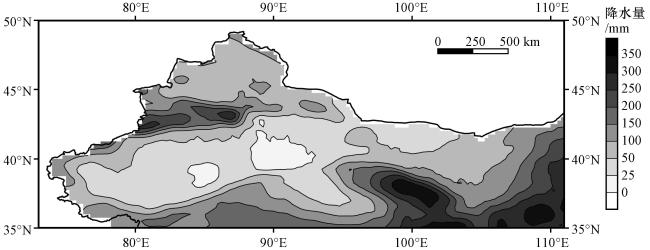
西北地区不同区域降水量差异较大(图1 ), 降水量由东向西减少, 并且表现为东部及西部偏北地区降水较多, 而中部降水较少的分布态势。西北地区东部受季风影响, 降水量高于西北大部分地区; 天山地区、 祁连山地区的降水显著高于南疆盆地、 柴达木盆地等地势低洼的区域, 这说明地形的抬升作用对降水具有很大影响。在陕中和祁连山地区存在有>300 mm的降水区域, 而天山地区降水中心的最大降水量也可以超过250 mm; 而在塔克拉玛干沙漠、 柴达木盆地以及巴丹吉林沙漠大部分地区夏季降水量不超过50 mm。
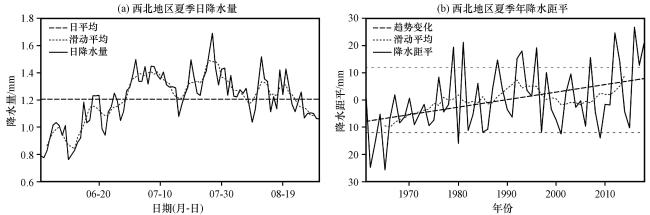
由于西北地区降水量区域性差异较大, 西部沙漠部分地区夏季降水量与东部区域降水相差近10倍, 为更好反映西北地区降水量的时空变化特征, 计算年降水比率(该年降水量/多年平均降水量)对西北地区进行EOF分解。结果发现, 第1、 第2和第3特征向量的方差贡献率分别为28.86%、 17.19%和13.29%, 累计方差贡献率为59.35%(已通过North检验)。图3 为EOF分解结果的空间模态: 通过EOF1的模态可以看出, 西北地区西部地区为正值区, 在塔克拉玛干地区存在大值区; 而西北地区东部大部分地区无显著特征, 这说明西北地区西部与东部可能有不同的影响因子对其作用。由EOF2的空间分布可以看出, 南疆盆地与柴达木盆地为负值区, 西北地区东部以及西北地区西部北方为正值区。由EOF3的空间分布可以看出, 整个西北地区呈现一个“+-+-”的分布态势, 即82°E以西为正值区, 82°E -92°E为负值区, 92°E -102°E为正值区, 102°E以东为正值区。
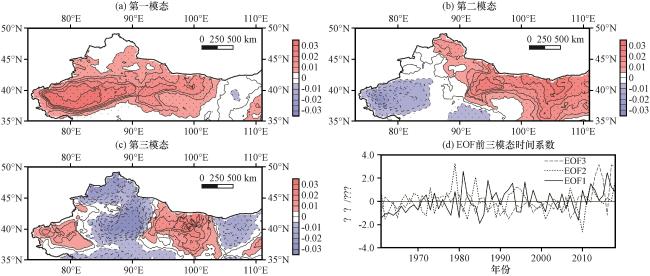
EOF1时间系数的变化趋势同夏季降水的变化趋势极为相近, 两者相关系数为0.71, 并且其呈现明显上升趋势, 结合EOF1空间模态, 表明在近几十年来, 西北地区西部尤其是南疆地区降水明显增加, 而东部变化并不明显。EOF2时间系数的变化趋势呈现一个波动状态, 无明显趋势, 但是存在年代际变化, 高于两倍标准差的年份出现在20世纪90年代前(1979年、 1984年), 低于两倍标准差的年份出现在20世纪90年代后(2010年)。EOF3时间系数的变化趋势在21世纪10年代前波动振幅较小, 变化不明显, 但在21世纪10年代后出现明显高值, 说明EOF3反映了21世纪10年代后降水偏高的特征分布。
通过EOF1的空间分布可以看出, 西北西部与东部的降水存在不同的影响因子, 于是以101°E为界把西北地区分为东西两块区域, 两部分降水分别作区域平均, 将两者定义为西北西降水指数(Western Precipitation Index of Northwest China, WNWRI)及西北东降水指数(Eastern Precipitation Index of Northwest China, ENWRI), 两者的相关系数为0.166, 说明西北地区西部与东部的降水之间相关性较弱, 应是存在不同的影响因子对两者进行作用。图4 (a)给出两者随时间变化趋势, 发现西北东部降水变化波动较大, 整体无明显趋势变化, 而西北西部降水波动较小, 但呈现明显上升趋势。图4 (b)和(c)分别给出两个指数ENWRI及WNWRI与西北地区降水的相关分布, 说明指数ENWRI能较为准确地反映西北东部大部分区域的降水特征, 而指数WNWRI对于西北西部地区降水特征反映效果不及东部, 甚至在北疆部分地区相关性未能通过检验。考虑指数的代表性后, 下文中将ENWRI作为预报量构建西北地区东部的降尺度预报模型。
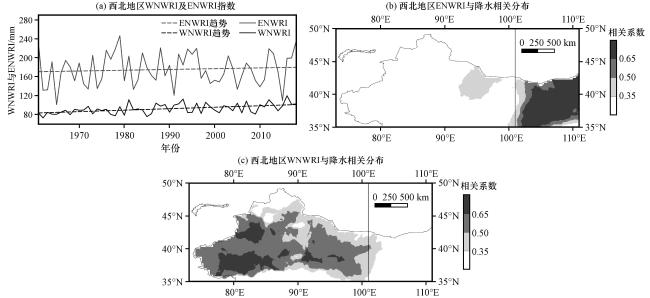
图4 1961 -2018年西北西降水指数(WNWRI)与西北东降水指数(ENWRI)及其拟合趋势(a), ENWRI指数(b)、 WNWRI指数(c)与西北地区降水的相关分布阴影区域已通过95%的显著性检验 Fig.4 WNWRI, ENWRI and their fitting trend (a) from 1961 to 2018, and the correlation distribution between the ENWRI (b)、 WNWRI (c) and precipitation in northwest China.The shaded area has passed 95% significance test |
4 统计降尺度模型的建立和检验
构建统计降尺度模型的假设是预报因子与预报量之间的关系能够维持稳定, 但是在较长的时间尺度上, 环流系统特征的年代际变化可能将导致其与局地降水之间的相关性发生转变, 因此得到预报模型以后, 必须采用建模时期以外的数据进行独立检验。故文章将1961 -2000年(40年)的降水数据用于模型的构建, 2001 -2018年(18年)的降水数据进行模型的检验。
4.1 模型因子选取
现有研究指出, 其他地区的变量信号可以通过遥相关作用于局地降水, 这使得影响区域性降水的因子可能是非局地的(Guo et al, 2011)。故将1961 -2000年的ENWRI与同期全球环流场(200 hPa、 500 hPa位势高度场, 海平面气压场, 850 hPa U、 V风场, 海表面温度场)做相关分析, 以找出影响西北地区东部区域降水的因子。如图5 所示, 在200 hPa位势高度场上, 中亚地区、 中国东北地区以及北美洲东、 西海岸均存在与ENWRI正相关的区域, 并且这些区域在500 hPa位势高度场上也有体现; 在海平面气压场上, 格陵兰岛以及马斯克林群岛南部与ENWRI呈负相关, 欧洲西部以及非洲西部的赤道地区与ENWRI呈正相关; 在850 hPa U、 V风场上, 新地岛以西的V风、 格陵兰岛以南及俄罗斯北部洋面的U风呈正相关关系; 在海表面温度场上, 北美洲西部的太平洋海温为正相关区域, 位于其南部的赤道太平洋海温为负相关区域。
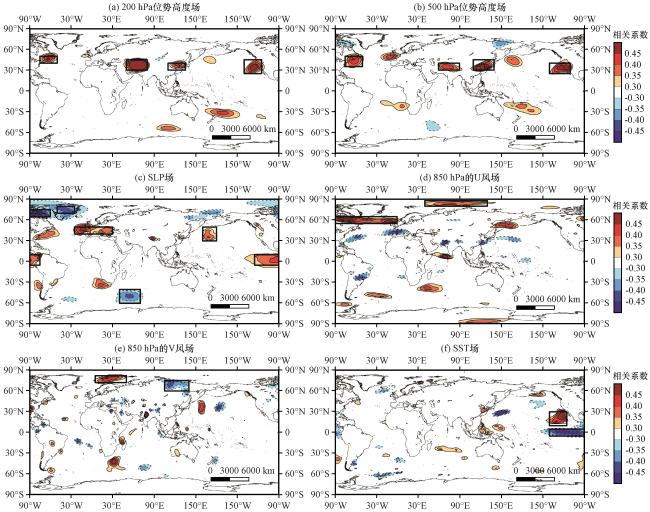
将图5 中挑选出的区域视为潜在预报因子, 每个矩形所围部分表示潜在预报因子的区域, 预报因子指数为方框内区域格点的平均值, 图5 中共找到20个潜在预报因子, 计算每个因子与ENWRI之间的RMSE, 并按照RMSE的大小进行排列, 挑选RMSE最小的因子, 最终选出200 hPa位势高度场上位于中亚地区(30°N -45°N, 50°E -80°E)的强迫因子, 加之其与ENWRI之间的相关系数(0.52)也通过99%置信水平的检验, 所以该因子被选定进入模型, 作为第一个预报因子, 将该因子记作 。
当第一个因子 选定后, 根据偏相关方法继续挑选影响因子, 将 的信号从降水信息中剔除: , 其中 为第一个因子 与ENWRI的线性拟合, 之后就得到与 无关的降水部分 , 将 与环流场进行相关分析, 重复上述步骤(图略), 直至挑选出的因子与ENWRI的相关性未能通过检验, 最终又挑选出三个影响因子, 分别为 (北太平洋850 hPa V风: 30°N -45°N, 175°E -170°W)、 (北大西洋850 hPa U风: 50°N -65°N, 60°W - 30°W)、 (南印度洋海平面气压: 40°S -50°S, 40°E -70°E)。之后继续进行挑选因子时, 未有通过检验的因子入选, 说明去除上述四个因子后剩余的降水信息与大尺度环流的关系较弱, 可能更多地反映为区域降水的内部变化。至此进入模型的因子筛选结束, 将选定的四个因子与ENWRI进行多元线性拟合, 得到预报模型:
式中: ENWRI为西北东降水指数(单位: mm); 为中亚地区(30°N -45°N, 50°E -80°E)200 hPa位势高度的平均(单位: gpm); 为北太平洋(30°N -45°N, 175°E -170°W)850 hPa V风的平均(单位: m·s-1); 为北大西洋(50°N -65°N, 60°W -30°W)850 hPa U风的平均(单位: m·s-1); 为南印度洋 (40°S -50°S, 40°E -70°E) 海平面气压的平均(单位: hPa)。
4.2 控制夏季ENWRI的因子的物理机制
通过偏相关因子挑选的方法, 找到了与西北地区东部降水有关的影响因子, 但对于这些因子如何影响西北地区东部降水的原理并不清楚, 本节将分析各个因子如何作用于西北地区东部降水的物理机制。
为了表现控制东部降水的各因子所对应的大尺度环流, 将各因子与大尺度环流场进行去趋势相关分析, 结果如图6 所示: 因子 与200 hPa 20°N -50°N之间的非洲北部、 中西亚地区及中国东北地区的位势高度呈现明显的正相关关系, 并且在中西亚地区及中国东北地区的这种强相关关系在500 hPa依然存在。因子 与850 hPa高度上的V风场在北太平洋地区呈现一个“-+-”的相关关系, 而这反映到海平面气压场上在150°E -180°及150°W - 180°之间的北太平洋地区分别存在一个与因子相关的负中心和正中心。因子 与850 hPa高度上的U风场在60°N附近的北大西洋地区呈显著正相关关系, 而在海平面气压场上与冰岛地区(北大西洋部分地区)呈显著负(正)相关关系。因子 与海平面气压场上北印度洋和南印度洋分别存在一个正相关区域, 且南印度洋区域的相关程度更大。由以上的各因子相关区域特征可以推测出: 因子 反映了中亚地区西风急流的强度; 因子 反映了北太平洋海平面气压的负正结构; 因子 反映了北大西洋涛动(North Atlantic Oscillation, NAO)的特征; 因子 反映了马斯克林高压的强度。由模型可知, 因子 与ENWRI呈正相关关系, 因子 与ENWRI呈负相关关系, 反映到各因子物理含义上则表现为中亚地区西风急流和NAO同西北地区东部降水呈正相关关系, 而北太平洋海平面气压的负正结构及马斯克林高压的强度与西北地区东部降水呈负相关关系。
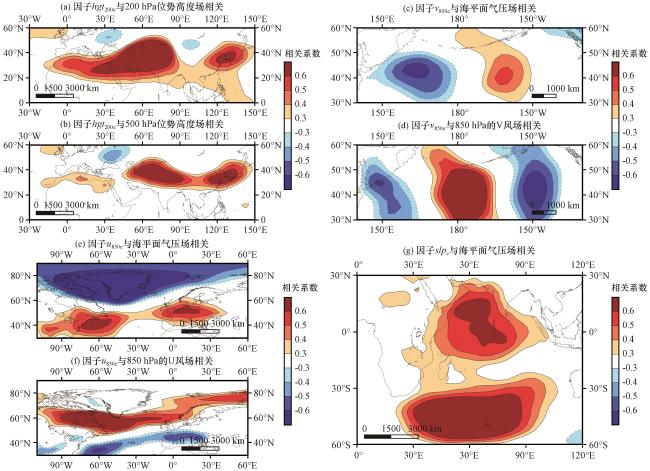
对于西风急流而言, 当中亚西风急流轴更偏北, 强度更大时有利于西北地区东部区域的降水, 而且有研究表明, 当西风带急流轴明显偏北且盛夏新疆上空西风风速偏强会导致新疆夏季降水偏少(魏林波等, 2012), 那么此时极有可能是由于偏北偏强的西风急流使得由西北过来的气流越过新疆地区作用到西北地区东部, 进而产生西北地区东部降水偏多的情况。对于NAO来说, 当冰岛低压越低且亚速尔高压越高, 即NAO越强时, 西风越强, 西北地区东部降水越强, 杨莲梅和张庆云(2008)指出, 当NAO处于正位相年时, 西亚急流位置偏北、 强度偏强、 Rossby波活动增强, 进而影响西北地区东部降水。对于北太平洋海平面气压的“-+”结构而言, 由于其与ENWRI呈负相关关系, 所以当该“-+”结构越弱, 甚至为“+-”结构时, 西北地区东部降水偏强。有研究表明, 南太平洋年代际振荡(South Pacific Decadal Oscillation, SPDO)指数与大气环流场的偏相关结果在北太平洋区域近似于“+-”结构, 并且SPDO为正位相时, 西太平洋副热带高压和鄂霍次克海高压强度偏弱(李刚等, 2020), 使得西北地区东部区域的降水偏多。对于马斯克林高压来说, 由于其与ENWRI呈负相关关系, 所以当马高偏弱时西北地区东部降水会偏多。南亚季风起源于马斯克林高压, 在东非沿岸越赤道后形成索马里急流, 以西南季风形式影响我国部分地区。作为影响我国的夏季风系统成员之一, 有研究表明, 当马高异常偏弱时, 坦桑尼亚东岸存在异常偏北气流, 表明索马里急流异常偏弱, 此时坦桑尼亚地区的异常气旋性环流的西部偏南气流同来自马斯克林高压区域的异常偏南气流, 经过南非, 在刚果盆地及其以西地区形成偏强的南风, 该异常偏南气流越过赤道后经过孟加拉湾和来自苏门答腊岛西部的偏南气流汇聚, 直至中南半岛, 然后再和副热带高压南部的偏东气流交汇, 使得中国东部地区受异常偏强的西南气流影响(张婕等, 2012), 导致西北地区东部降水偏多。
4.3 模型的建立与检验
本节利用影响因子 构建中国西北地区东部降水的统计模型, 由于研究西北地区东部降水为季节尺度的降水, 非线性特征较弱, 所以采取线性回归进行拟合, 根据1961 -2000年的降水资料, 得到 与甘肃省东部降水之间的多元回归模型[见式(1) ]。
模型中各因子 的标准化时间序列如图7 (a)~(d)所示, 反映的是西风急流, 当位势高度偏大时表示西风急流偏北偏强; 反映的是北太平洋海平面气压的“-+”结构, 当风速越大时表示“-+”结构越强; 代表的是NAO, 当风速越大时NAO越强; 反映的是马斯克林高压, 当压强越大时马高越强。由图7 (a)可以看出, 西风急流总体上呈波动上升趋势, 20世纪60~70年代初西风急流整体偏弱, 而70年代中期到90年代初期强度整体偏强(1984年强度达到最大), 2000年前后整体处于平均强度附近变化较小, 在2010年后整体较强并且呈明显上升趋势; 由图7 (b)可以看出北太平洋海平面气压的“-+”结构总体上呈波动变化, 无明显趋势; 由图7 (c)可以看出, NAO没有明显变化趋势, 但在20世纪90年前波动变化较强(相临近年的正负变化较大), 而在20世纪90年代后波动变化较弱; 由图7 (d)可以看出, 马斯克林高压在20世纪70年代中期以前整体强度偏大, 之后强度整体有所降低(在1989年强度最低), 而在2000年后正负波动较为明显。图7 (e)为实际和拟合的西北地区东部降水ENWRI时间序列, 在模型建立阶段平均降水偏差为17.5 mm, 平均偏差率为10.3%, 在模型检验阶段平均降水偏差为26.2 mm, 平均偏差率为16.4%。从趋势拟合效果来看, 模型建立阶段的趋势拟合效果更好, 模型检验阶段的趋势拟合效果较差, 各因子和拟合结果与ENWRI之间的相关关系如表1 所示, 在模型建立阶段, 拟合结果和各因子与ENWRI的相关性均通过了98%水平的显著性检验, 而就整个研究时段而言, 拟合结果和各因子与ENWRI相关性均有所下降, 但仍能通过98%显著性检验, 只有因子 与ENWRI的相关性仅通过95%水平的, 未能通过98%水平的显著性检验。 反映了影响东亚夏季风的成员马斯克林高压的变化, 有研究表明, 东亚夏季风在20世纪70年代后较之前偏弱, 且马斯克林高压影响东亚地区的位置较之前偏南(张婕等, 2012; 薛峰等, 2003), 这可能导致了马斯克林高压与西北地区东部降水的关系发生了年代际变化。当影响因子与预报量之间发生了年代际上相关性的减弱, 这将影响到模型的预报效果, 导致模型误差变大。
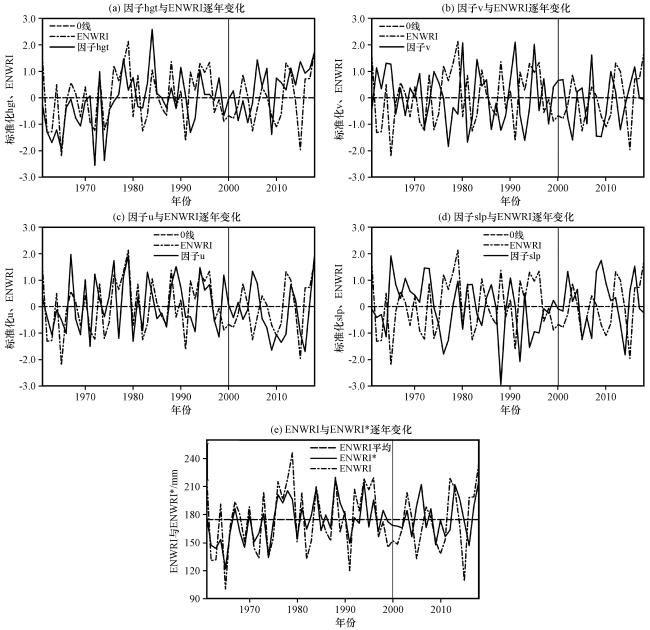


图7 因子 与ENWRI标准化后的时间序列, 以及实际降水和拟合的西北地区东部降水ENWRI时间序列(e)Fig.7 The standardized time series of factors and ENWRI (e), respectively.And the actual and fitted ENWRI time series of precipitation in the eastern part of northwest China |
表1 模型各因子及模拟结果与ENWRI相关系数Table 1 Correlation coefficient between each factor and result of the model with ENWRI |
| 模型因子 | 1961 -2000年相关系数 | 1961 -2018年相关系数 |
|---|---|---|
| 0.52** | 0.42** | |
| 0.40** | 0.31** | |
| 0.48** | 0.41** | |
| 0.38** | 0.30* | |
| 0.80** | 0.64** |
**、 *分别表示通过98%和95%的显著性水平检验 |
5 结论
本文采用统计和偏相关、 去趋势相关分析的方法, 分析了1961 -2018年西北地区夏季降水特征, 并且重点关注针对西北地区东部降水并构建了统计降尺度模型, 具体结论如下:
(1) 西北地区夏季降水主要集中在七月初到八月下旬, 并且1961 -2018年西北地区夏季降水量呈现增加趋势, 2011 -2018年中有5年的降水超过一倍标准差, 西北地区西部降水明显增加, 而西北地区东部降水呈波动状态(无明显趋势变化), 但空间上西北地区降水整体仍表现为东多西少。
(2) 针对西北地区东部降水进行成因研究, 采用偏相关因子选取法, 找到了影响西北地区东部降水的4个因子 , 这4个因子分别反映了西风急流的特征、 北太平洋海平面气压的“-+”结构、 NAO的特征及马斯克林高压的强度, 利用这4个因子建立的统计降尺度模型较好地拟合了西北地区东部降水。当西风急流偏北偏强, 北太平洋海平面气压“-+”结构减弱, NAO偏强或马斯克林高压偏弱时, 有利于西北地区东部降水, 反之亦然。
(3) 在降尺度模型建立阶段, 模型结果偏差为17.5 mm, 平均偏差率为10.3%。在模型检验阶段, 模型结果偏差为26.2 mm, 平均偏差率为16.4%。从趋势拟合效果来看, 模型建立阶段的趋势拟合效果更好, 模型检验阶段的趋势拟合效果较差, 原因可能是某些影响因子与预报量之间发生了年代际上相关性的减弱, 这将影响到模型的预报效果, 导致模型误差变大。
本文针对西北地区降水的统计降尺度模型经过检验取得了一定的预报效果, 模型建立阶段平均偏差率为10.3%, 在模型检验阶段平均偏差率为16.4%, 同华北汛期降水统计降尺度模型检验阶段的误差率14.8%相比(郭彦和李建平, 2012), 准确率偏差不大。这说明了在西北地区基于大尺度环流信息, 开展统计降尺度的降水预测是可行的。在下一步工作中, 将进一步探讨基于数值预报产品, 选择对于西北地区降水有显著影响的前期强迫因子, 建立更加适用于降水短期气候预测实际业务的模型。