
1 引言
2 数据来源与方法介绍
2.1 数据来源
2.2 模式介绍
2.3 研究方法
2.3.1 模拟方案
2.3.2 水汽源区贡献率计算
2.3.3 水汽通量计算
3 结果分析
3.1 降水异常分析
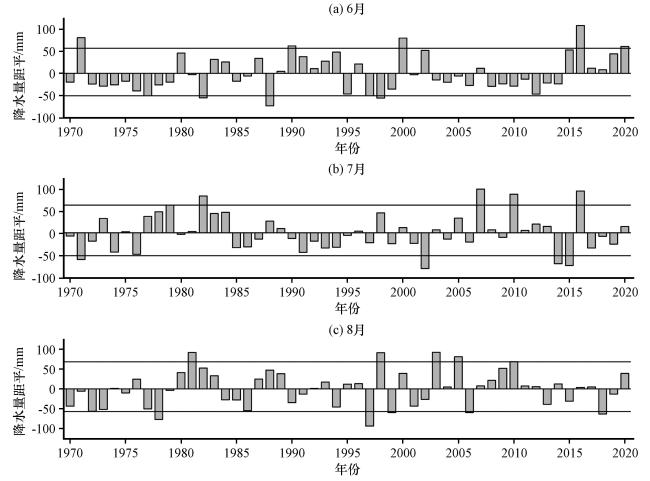
图3 秦巴地区1970 -2020年6 -8月降水量距平逐年变化Fig.3 Interannual variation of precipitation anomaly in the June-August from 1970 to 2020 over the Qinba Mountains |
表1 降水异常年份选取Table 1 Selection the years of precipitation anomaly |
| 月份 | 降水高值年 | 降水低值年 |
|---|---|---|
| 6月 | 1971 1990 2000 2016 2020 | 1977 1997 1982 1988 1998 |
| 7月 | 1979 1982 2007 2010 2016 | 1971 2002 2014 2015 |
| 8月 | 1981 1998 2003 2005 2010 | 1978 1997 1999 2006 2018 |
3.2 水汽输送路径及源地贡献量
3.2.1 降水高值年水汽输送特征
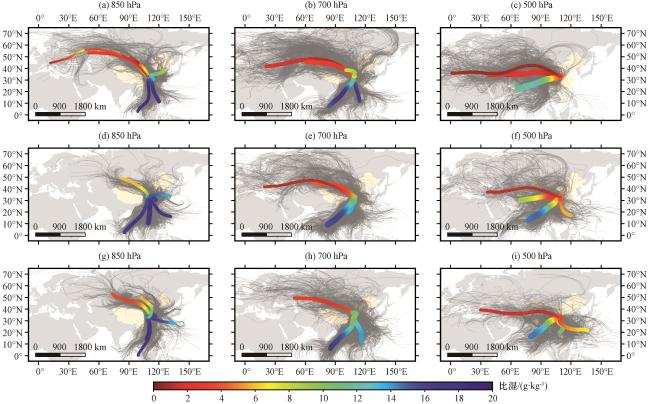
图4 降水高值年6月(a~c)、 7月(d~f)、 8月(g~i)在850 hPa(左, AGL=500 m)、 700 hPa(中, AGL=2000 m)以及500 hPa(右, AGL=5000 m)的水汽通道特征灰色细线为模式输出的原始气块运移轨迹, 彩色线为聚类后的轨迹结果, 粗细表示该通道聚类前包含的轨迹数量, 颜色表示通道上包含所有轨迹的平均比湿(单位: g·kg-1) Fig.4 Water vapor channel characteristics in June (a~c), July (d~f), and August (g~i) at 850 hPa (left, AGL=500 m), 700 hPa(center, AGL=2000 m), and 500 hPa (right.AGL=5000 m) in the high precipitation years.The thin gray line is the original gas block migration trajectory output by the mode, the colored line is the trajectory result after clustering, The channel thickness indicates the number of trajectories included in the channel before clustering, and the colour indicates the average specific humidity (units: g·kg-1) of all trajectories included in the channel |
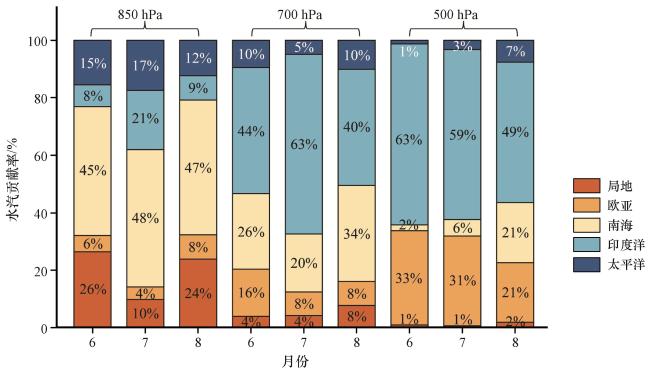
表2 秦巴地区降水高值年6-8月各通道在不同高度层的轨迹数量占比Table 2 The ratio of the trajectories’ number of each channel in June-August of the high precipitation years at different vertical heights over the Qinba Mountains |
| 高度层 | 月份 | 局地 | 欧亚大陆 | 南海 | 印度洋 | 太平洋 |
|---|---|---|---|---|---|---|
| 850 hPa | 6月 | 24.69% | 21.47% | 30.80% | 5.17% | 17.87% |
| 7月 | 17.71% | 10.84% | 42.15% | 14.84% | 14.45% | |
| 8月 | 20.72% | 24.56% | 35.26% | 6.76% | 12.70% | |
| 700 hPa | 6月 | 3.77% | 48.31% | 13.92% | 25.12% | 8.88% |
| 7月 | 3.82% | 27.11% | 16.00% | 48.46% | 4.61% | |
| 8月 | 7.02% | 23.59% | 27.45% | 31.59% | 10.36% | |
| 500 hPa | 6月 | 0.97% | 67.97% | 0.93% | 28.92% | 1.13% |
| 7月 | 0.52% | 43.66% | 8.16% | 42.06% | 5.62% | |
| 8月 | 2.42% | 28.35% | 21.54% | 34.41% | 13.31% |
加粗字体表示轨迹数量占比较大的通道, 表示主要水汽通道(Bold font indicates the channel with a relatively large number of tracks in each channel) |
3.2.2 降水低值年水汽输送特征
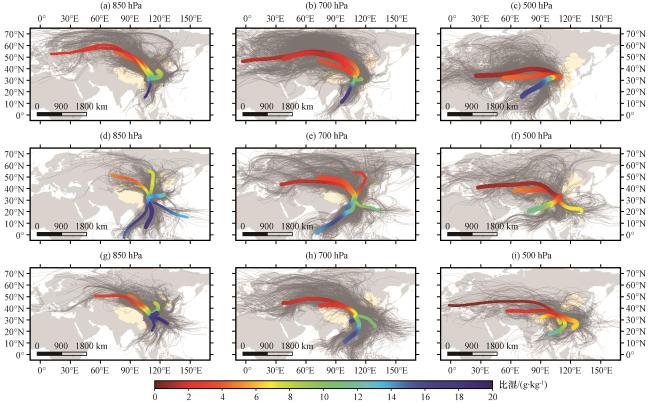
图6 降水低值年 6月(a~c)、 7月(d~f)、 8月(g~i)在850 hPa(左, AGL=500 m)、 700 hPa(中, AGL=2000 m)以及500 hPa(右, AGL=5000 m)的水汽通道特征灰色细线为模式输出的原始气块运移轨迹, 彩色线为聚类后的轨迹结果, 粗细表示该通道聚类前包含的轨迹数量, 颜色表示通道上包含所有轨迹的平均比湿(单位: g·kg-1) Fig.6 Water vapor channel characteristics in June (a~c), July (d~f), and August (g~i) at 850 hPa (left, AGL=500 m), 700 hPa(center, AGL=2000 m), and 500 hPa (right, AGL=5000 m) of the low precipitation years.The thin gray line is the original gas block migration trajectory output by the mode, the colored line is the trajectory result after clustering, The channel thickness indicates the number of trajectories included in the channel before clustering, and the colour indicates the average specific humidity (units: g·kg-1) of all trajectories included in the channel |
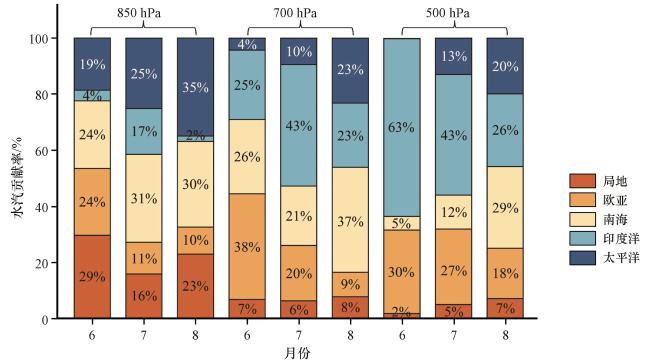
表3 秦巴地区降水低值年6 -8月各通道在不同高度层的轨迹数量占比Table 3 The ratio of the trajectories’ number of each channel in June-August of the low precipitation years at different vertical heights over the Qinba Mountains |
| 高度层 | 月份 | 局地 | 欧亚大陆 | 南海 | 印度洋 | 太平洋 |
|---|---|---|---|---|---|---|
| 850 hPa | 6月 | 20.91% | 51.43% | 10.41% | 1.41% | 15.86% |
| 7月 | 14.88% | 22.62% | 22.42% | 13.11% | 26.97% | |
| 8月 | 19.12% | 28.23% | 21.58% | 1.54% | 29.53% | |
| 700 hPa | 6月 | 4.54% | 77.42% | 8.39% | 6.90% | 2.75% |
| 7月 | 4.52% | 50.28% | 10.75% | 23.77% | 10.69% | |
| 8月 | 4.53% | 40.80% | 22.70% | 13.77% | 18.20% | |
| 500 hPa | 6月 | 1.45% | 65.21% | 2.14% | 30.82% | 0.40% |
| 7月 | 2.89% | 53.29% | 8.19% | 22.55% | 13.08% | |
| 8月 | 8.60% | 35.69% | 20.15% | 13.95% | 21.62% |
加粗字体表示轨迹数量占比较大的通道, 表示主要水汽通道(Bold font indicates the channel with a relatively large number of tracks in each channel) |
3.3 基于欧拉方法的水汽输送特征
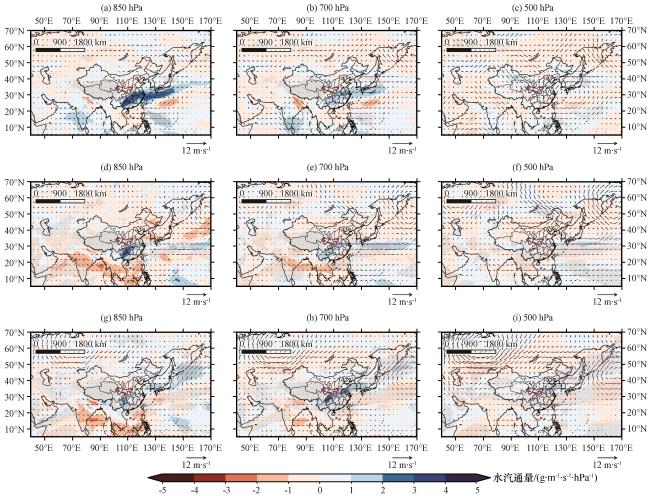
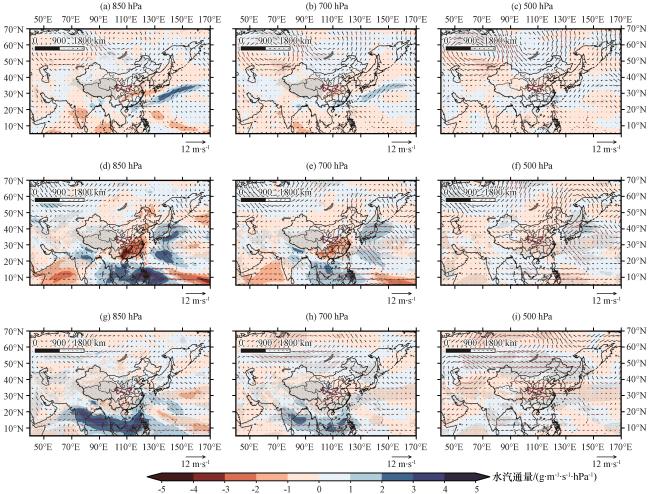
图8 降水高值年6月(a~c)、 7月(d~f)、 8月(g~i)850 hPa(左, AGL=500 m)、 700 hPa(中, AGL=2000 m)以及500 hPa(右, AGL=5000 m)水汽通量与1970 -2020年同期水汽通量(彩色区, 单位: g·m-1·s-1·hPa-1)及风场(矢量, 单位: m·s-1)的合成分析灰色阴影和红色箭头分别为通过显著性检验的水汽通量和风场, 红色实线范围表示秦巴山区范围 Fig.8 Water vapor fluxes anomalies (color area, unit: g·m-1·s-1·hPa-1) and wind anomalies (vectors, unit: m·s-1) in June (a~c), July (d~f), and August (g~i) at 850 hPa (left, AGL=500 m), 700 hPa (center, AGL=2000 m), and 500 hPa(right, AGL= 5000 m) in high precipitation years.The grey shading and the red arrows are respectively the water vapor fluxes and wind fields that passed the significance test, the solid red line range indicates the range of Qinba Mountain |
图9 降水低值年6月(a~c)、 7月(d~f)、 8月(g~i)850 hPa(左, AGL=500 m)、 700 hPa(中, AGL=2000 m)以及500 hPa(右, AGL=5000 m)水汽通量与1970 -2020年同期水汽通量(彩色区, 单位: g·m-1·s-1·hPa-1)及风场(矢量, 单位: m·s-1)的合成分析Fig.9 Water vapor fluxes anomalies (color area, unit: g·m-1·s-1·hPa-1) and wind anomalies (vectors, unit: m·s-1) in June (a~c), July (d~f), and August (g~i) at 850 hPa (left, AGL=500 m), 700 hPa (center, AGL=2000 m), and 500 hPa (right, AGL= 5000 m) in low precipitation years.The grey shading and the red arrows are respectively the water vapor fluxes and wind fields that passed the significance test, the solid red line range indicates the range of Qinba Mountain |